In this tutorial, you will learn how to create a WordCloud of your own in Python and customise it as you see fit. Specifically, we will focus on how to generate a WorldCloud from a column in Pandas dataframe. This type of visualisation will be quite handy for exploring text data and making your presentation more lively.
What is a WordCloud?
A WorldCloud /Word Cloud (also known as a tag cloud or word art) is a simple visualisation of data, in which words are shown in varying sizes depending on how often they appear in your text/data.
There are many free word cloud generators online that can help you perform text analysis, and spot trends and patterns at a glance. Python is not the only tool capable of creating such visuals. So if you need to make a word cloud visualisation quickly and you are not working with your data in Python, then this tutorial is not for you.
Tutorial structure
In this tutorial, we will use a rose data scraped from Helpmefind.com, but you can use any other data set to learn:
- How to create a WorldCloud from a column in Pandas dataframe
- Mask your WordCloud into any shape of your choice
WorldCloud install
In order to create a WorldCloud viz in Python you will need to install below packages:
First four packages are data analytics staples, so don't require an introduction.
The pillow library is a package that enables image reading. You can find a tutorial for pillow here. Pillow is a wrapper for PIL - Python Imaging Library. You will need this library to read in an image as the mask for the WordCloud.
The wordcloud library is the one responsible for creating WorldClouds. It can be a little tricky to install. If you only need it for plotting a basic WordCloud, then running one of the commands below would be sufficient.
pip install wordcloud
or conda install -c conda-forge wordcloud for Anaconda-Navigator.
However, if you are after the library with the ability to mask the cloud into any shape of your choice, you will need the latest version that requires a different method of installation.
git clone https://github.com/amueller/word_cloud.git
cd word_cloud
pip install .
Import Libraries & Create a Dataframe
# Importing libraries

import numpy as np
import pandas as pd
from os import path
from PIL import Image
from wordcloud import WordCloud, STOPWORDS, ImageColorGenerator
import matplotlib.pyplot as plt

# Run below comand if you are running IPython

% matplotlib inline
Magic command %matplotlib inline will make your plot outputs appear and be stored within the notebook.
Next step is to import your csv file with data and create Pandas dataframe from it.
# Creating dataframe from csv
# Dataframe name is df1

df1 = pd.read_csv('Helpmefind_roses_merged_cleanned.csv')

# My file did not have titles so I manually assigned them

df1.columns = ["Unnamed: 0","NAME","URL","SYNONYM","ARS","ORIG","CLASS","BLOOM","HABIT","GROWING","PARENTAGE","COMMENTS","BRED_BY","INTRODUCED_FULL", "INTRODUCED", "YEAR_CREATED", "BRED_BY_DOB", "ALL_YEARS", "COUNTRY", "EXH_NAME","REGISTR_NAME", "PETALS", "COLOR", "PETALS2", "PETALS3", "ALL_PETALS_BRACKETS", "MAIN_COLOR" ]

# Then I removed column "Unnamed: 0"

del df1['Unnamed: 0']

# Listing basic info about the file
# Just to check that everything imported correctly from the csv file

df1.info()
Below you can see info about my dataset:
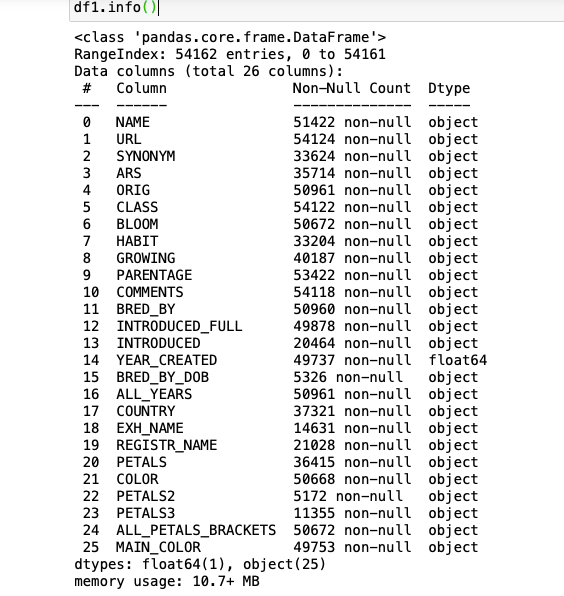
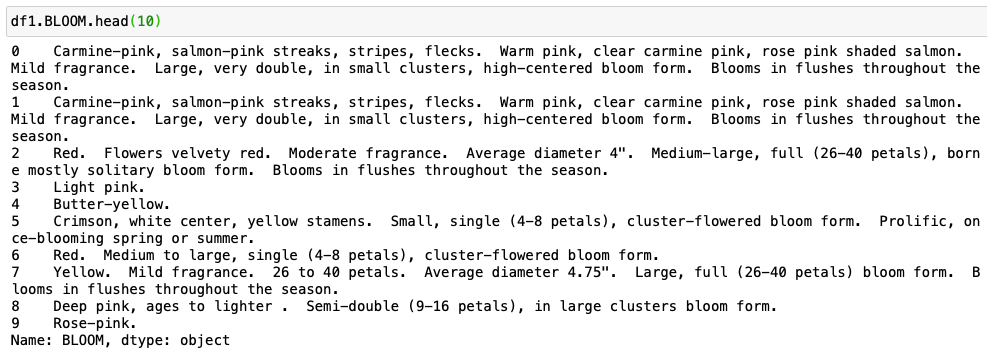
In this article, I will demonstrate how easy it is to make your own worldcloud visuals from a column in Pandas datafreame. As an example, I will use a column named BLOOM from my dataframe named df1. Below you can see the first ten rows from the dataframe.
Create a simple WordCloud visual from a column in Pandas dataframe
In this step, we create two important strings for our WorldCloud generation.
WordCloud.generate(text) method will generate wordcloud from text.
The WordCloud method expects a text file / a string on which it will count the word instances. But we want to use it on Pandas dataframe, so we will need to transform our input for it to work with the WordCloud.generate() method.
The ‘text’ is the string that will be used to store all the words from your column in a single line of text.
This you can do in the following way:
Firstly, you will need to create a text list of all words in column bloom.
text = " ".join(review for review in df.YOUR_COLUMN_NAME.astype(str))
Secondly, you will need to print how many words are in the text list that you just created from the Pandas column.
print ("There are {} words in the combination of all cells in column YOUR_COLUMN_NAME.".format(len(text)))
Next step is to create a list of stop words.
The ‘stopwords’ list is used to store all the words that are very commonly used in the English language such as ‘the’, ‘a’, ‘an’, ‘in’. Plus you can add any other words that you don't want to go in your world cloud. These words will be later filtered while generating the word cloud.
stopwords = set(STOPWORDS)
If you need to add any custom word exclusions use below:
stopwords.update(["bloom", "rose", "petals", "Average", "diameter","flushes", 'throughout', "Blooms", "form"])
In the above example, I am excluding words: bloom, rose, petals, average, diameter, flushes, throughout, blooms, and form. You will need to replace those with your custom word exclusions.
Now we are finally ready to generate a WorldCloud image. It is time to run
WorldClound().generate(text)
It accepts the following Parameters:
- font_path : string - Font path to the font that will be used (OTF or TTF).
- width : int(default=400) - Width of the canvas.
- heightint : int(default=200) - Height of the canvas.
- prefer_horizontal : float (default=0.90) -The ratio of times to try horizontal fitting as opposed to vertical. If prefer_horizontal < 1, the algorithm will try rotating the word if it doesn’t fit. (There is currently no built-in way to get only vertical words.)
- mask : nd-array or None (default=None) - If not None, gives a binary mask on where to draw words. If mask is not None, width and height will be ignored and the shape of mask will be used instead. All white (#FF or #FFFFFF) entries will be considerd “masked out” while other entries will be free to draw on. [This changed in the most recent version!]
- contour_width: float (default=0) - If mask is not None and contour_width > 0, draw the mask contour.
- contour_color: color value (default=”black”) - Mask contour color.
- scale : float (default=1) - Scaling between computation and drawing. For large word-cloud images, using scale instead of larger canvas size is significantly faster, but might lead to a coarser fit for the words.
- min_font_size : int (default=4) - Smallest font size to use. Will stop when there is no more room in this size.
- font_step : int (default=1) - Step size for the font. font_step > 1 might speed up computation but give a worse fit.
- max_words : number (default=200) - The maximum number of words.
- stopwords : set of strings or None - The words that will be eliminated. If None, the build-in STOPWORDS list will be used. Ignored if using generate_from_frequencies.
- background_color : color value (default=”black”) - Background color for the word cloud image.
- max_font_size : int or None (default=None) - Maximum font size for the largest word. If None, height of the image is used.
- mode : string (default=”RGB”) - Transparent background will be generated when mode is “RGBA” and background_color is None.
- relative_scaling : float (default=’auto’) - Importance of relative word frequencies for font-size. With relative_scaling=0, only word-ranks are considered. With relative_scaling=1, a word that is twice as frequent will have twice the size. If you want to consider the word frequencies and not only their rank, relative_scaling around .5 often looks good. If ‘auto’ it will be set to 0.5 unless repeat is true, in which case it will be set to 0.
- color_func : callable, default=None - Callable with parameters word, font_size, position, orientation, font_path, random_state that returns a PIL color for each word. Overwrites “colormap”. See colormap for specifying a matplotlib colormap instead. To create a word cloud with a single color, use
color_func=lambda *args, **kwargs: "white". The single color can also be specified using RGB code. For examplecolor_func=lambda *args, **kwargs: (255,0,0)sets color to red. - regexp : string or None (optional) - Regular expression to split the input text into tokens in process_text. If None is specified,
r"\w[\w']+"is used. Ignored if using generate_from_frequencies. - collocations : bool, default=True - Whether to include collocations (bigrams) of two words. Ignored if using generate_from_frequencies.
- colormap : string or matplotlib colormap, default=”viridis” - Matplotlib colormap to randomly draw colors from for each word. Ignored if “color_func” is specified.
- normalize_plurals : bool, default=True - Whether to remove trailing ‘s’ from words. If True and a word appears with and without a trailing ‘s’, the one with trailing ‘s’ is removed and its counts are added to the version without trailing ‘s’ – unless the word ends with ‘ss’. Ignored if using generate_from_frequencies.
- repeat : bool, default=False - Whether to repeat words and phrases until max_words or min_font_size is reached.
- include_numbers : bool, default=False - Whether to include numbers as phrases or not.
- min_word_length : int, default=0 - Minimum number of letters a word must have to be included.
- collocation_threshold: int, default=30 - Bigrams must have a Dunning likelihood collocation score greater than this parameter to be counted as bigrams. Default of 30 is arbitrary.
If you want to generate a world cloud with stopwords excluded, with a white background, a width of 800, and a height of 400 then run below.
wordcloud = WordCloud(stopwords=stopwords, background_color="white", width=800, height=400).generate(text)
Please remember that you can specify your look of the word cloud using parameters.
Now that you generated a world cloud, it is time to display it in your notebook using matplotlib.
plt.axis("off")
plt.figure( figsize=40,20)
plt.tight_layout(pad=0)
plt.imshow(wordcloud, interpolation='bilinear')
plt.show()
You may wonder why we use the argument interpolation="bilinear" in the plt.imshow(). This is to make the displayed image appear more smoothly.
Let's combine all lines of code that we need to run in order to make a WordCloud vis for column BLOOM.
# Python program to generate WordCloud for column BLOOM
# Text of all words in column bloom
text = " ".join(review for review in df1.BLOOM.astype(str))
print ("There are {} words in the combination of all cells in column BLOOM.".format(len(text)))
# Create stopword list:
# remove words that we want to exclude
stopwords = set(STOPWORDS)
stopwords.update(["bloom", "rose", "petals", "Average", "diameter","flushes", 'throughout', "Blooms", "form"])
# Generate a word cloud image
wordcloud = WordCloud(stopwords=stopwords, background_color="white", width=800, height=400).generate(text)
# Display the generated image:
# the matplotlib way:
plt.axis("off")
plt.figure( figsize=(40,20))
plt.tight_layout(pad=0)
plt.imshow(wordcloud, interpolation='bilinear')
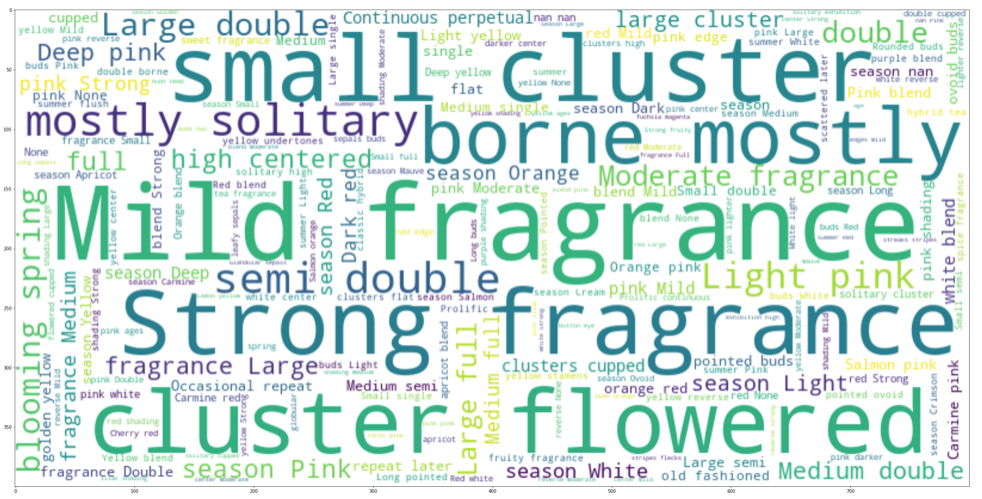
plt.show()Above code will produce the following message and a Worldcloud based on words in column BLOOM inside Dataframe df1.

Mask your wordcloud into any shape of your choice
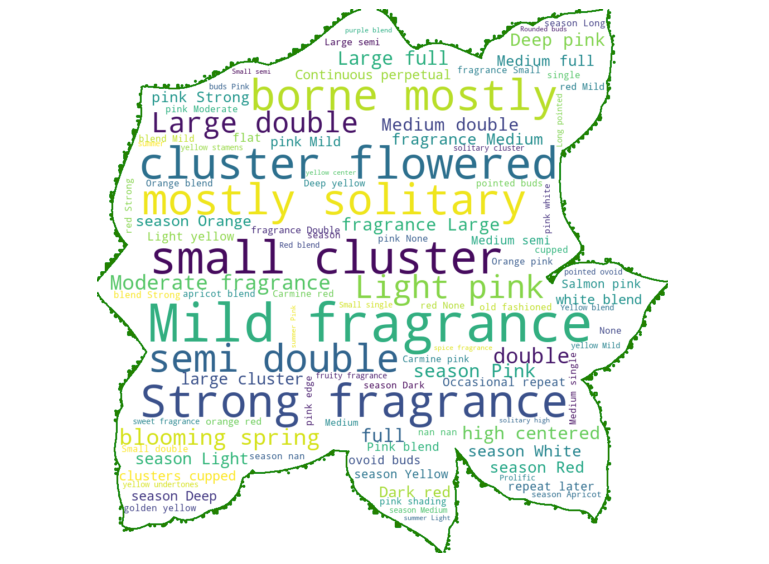
Now, let's create a rose-shaped word cloud for words in column BLOOM.
Seriously, you can use any shape you want with the WorldCloud method in Python.
To create a shape for your WordCloud, first, you need to find a JPG file to become the mask. Below is a simple rose shape that I found on the internet:

Not all mask images are the same so expect different outcomes. Some may not work with the WordCloud function. To make sure that your mask works, let's take a look at it in the NumPy array form:
# converting jpg image to a numpy array

rose_mask = np.array(Image.open("1599661.jpg"))
rose_mask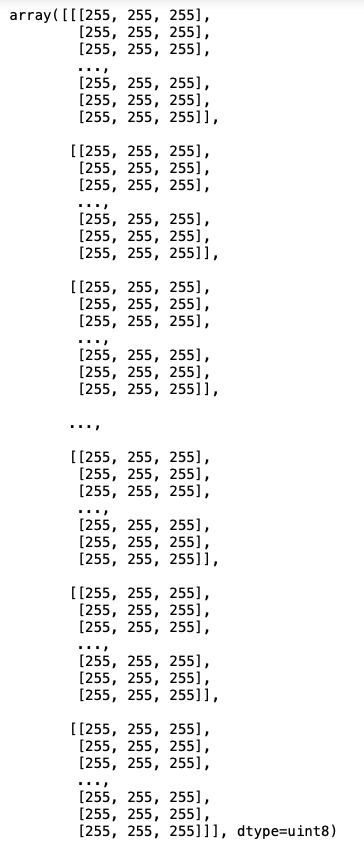
The way the masking functions works is that it requires all-white part of the mask should be 255. If you use a JPG file then you should get 255 in your array, while PNG file will populate your array with 0 (integer type). This value represents the "intensity" of the pixel. Values of 255 are pure white, whereas values of 1 are black. Please note that WorldCloud will not work with the PNG image straight away and you will need to transform it in order for it to work correctly.
Rose_mask array is populated with the 255, so everything is ready for the next stage.
Lets' make a wordcloud with the selected shape. Notice in the WordCloud function, there is a mask argument that takes in the mask that you created from the JPG image above. The contour_width and contour_color are arguments that allow you to adjust the outline characteristics of the cloud.
# Create a word cloud image

wc = WordCloud(background_color="white", max_words=100, mask=rose_mask,
               stopwords=stopwords, contour_width=3, contour_color='green')

# Generate a wordcloud

wc.generate(text)

# store to file

wc.to_file("rose_bloom.png")

# show

plt.figure(figsize=[20,10])
plt.imshow(wc, interpolation='bilinear')
plt.axis("off")
plt.show()
Hurray! You created a wordcloud in the shape of a rose!