
Before you start any data project, you need to take a step back and look at the dataset before doing anything with it. Exploratory Data Analysis (EDA) is just as important as any part of data analysis because real datasets are really messy, and lots of things can go wrong if you don't know your data. The Pandas library is equipped with several handy functions for this very purpose, and value_counts is one of them. Pandas value_counts returns an object containing counts of unique values in a pandas dataframe in sorted order. However, most users tend to overlook that this function can be used not only with the default parameters. So in this article, I’ll show you how to get more value from the Pandas value_counts by altering the default parameters and a few additional tricks that will save you time.
What is value_counts() function?
The value_counts() function is used to get a Series containing counts of unique values. The resulting object will be in descending order so that the first element is the most frequently-occurring element. Excludes NA values by default.
Syntax
df['your_column'].value_counts() - this will return the count of unique occurences in the specified column.
It is important to note that value_counts only works on pandas series, not Pandas dataframes. As a result, we only include one bracket df['your_column'] and not two brackets df[['your_column']].
Parameters
- normalize (bool, default False) - If True then the object returned will contain the relative frequencies of the unique values.
- sort (bool, default True) - Sort by frequencies.
- ascending (bool, default False) - Sort in ascending order.
- bins (int, optional) - Rather than count values, group them into half-open bins, a convenience for
pd.cut, only works with numeric data. - dropna (bool, default True) -Don’t include counts of NaN.
Loading a dataset for live demo
Let’s see the basic usage of this method using a dataset. I’ll be using the Coursera Course Dataset from Kaggle for the live demo. I have also published an accompanying notebook on git, in case you want to get my code.
Let’s start by importing the required libraries and the dataset. This is a fundamental step in every data analysis process. And then review the dataset in Jupyter notebooks.
# import package
import pandas as pd

# Loading the dataset
df = pd.read_csv('coursea_data.csv')

#quick look about the information of the csv
df.head(10)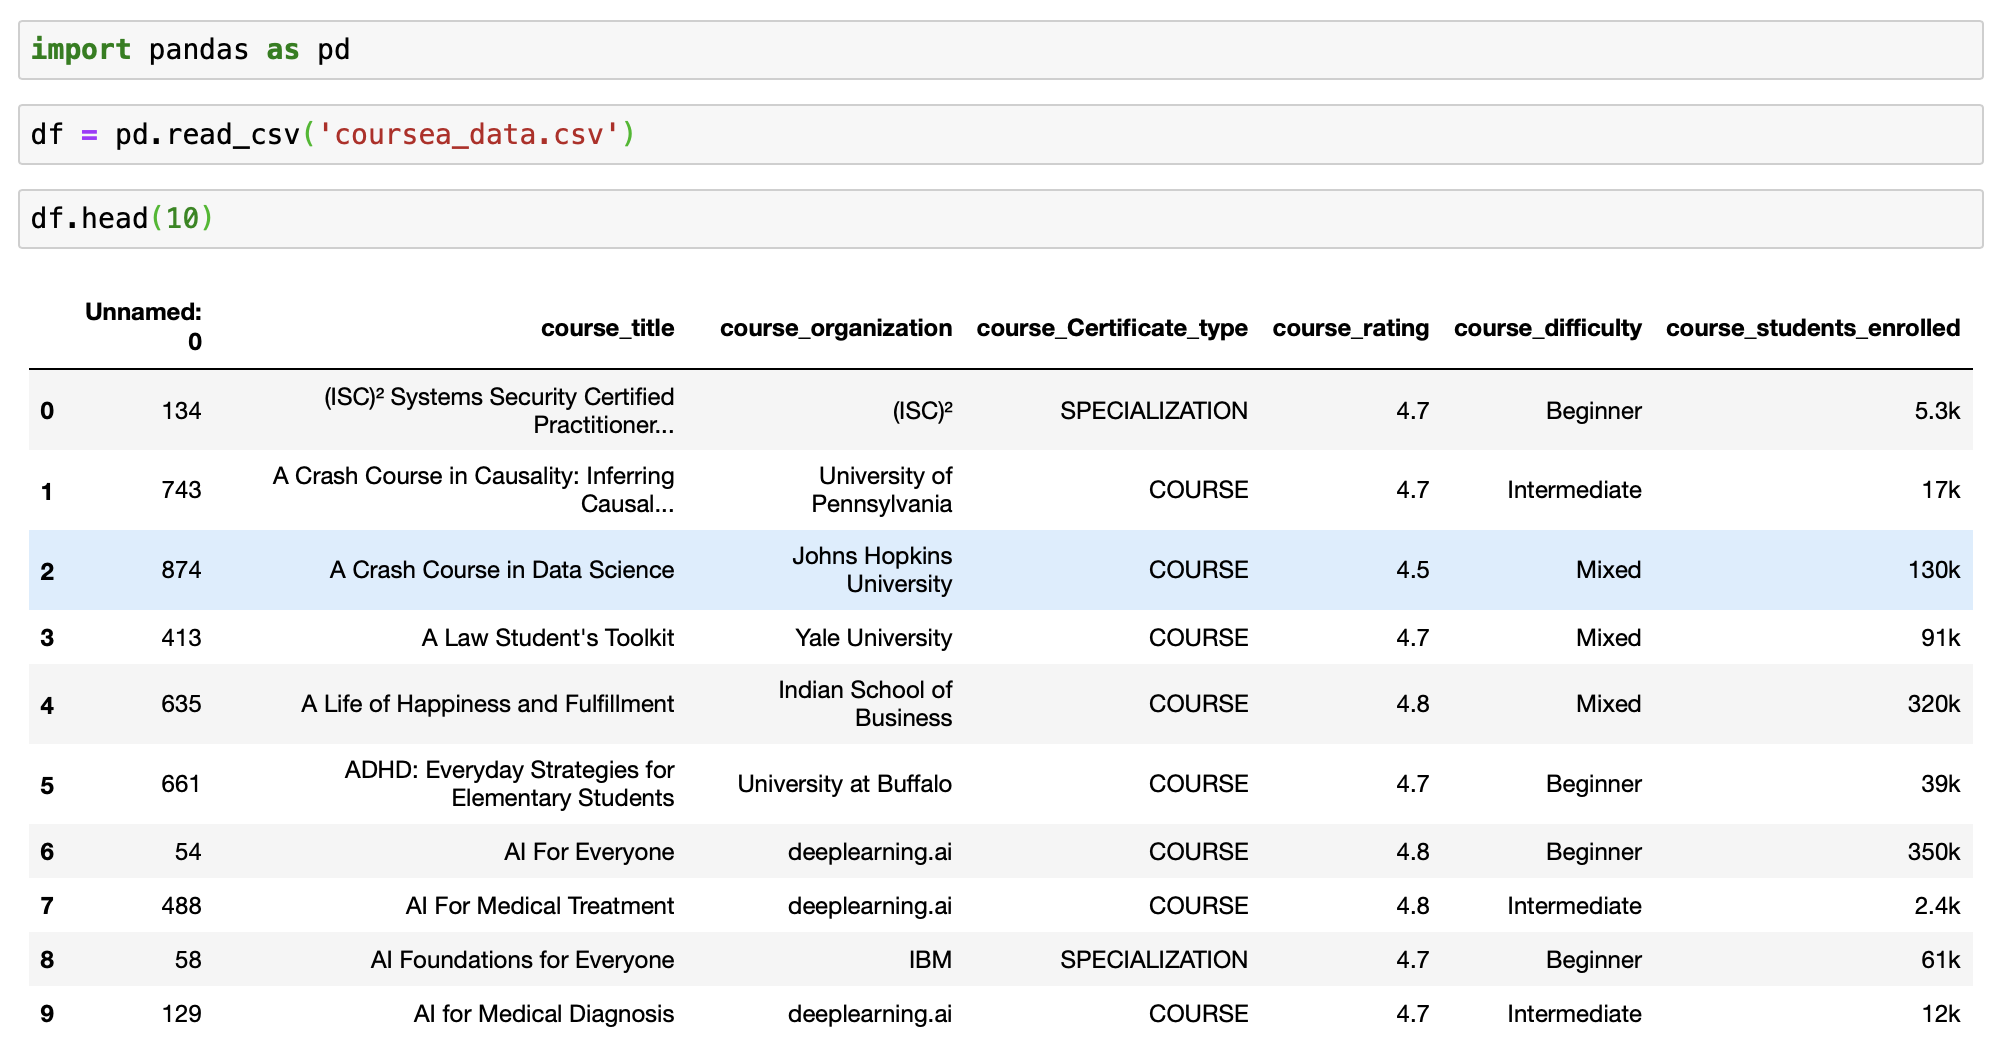
# check how many records are in the dataset
# and if we have any NA

df.info()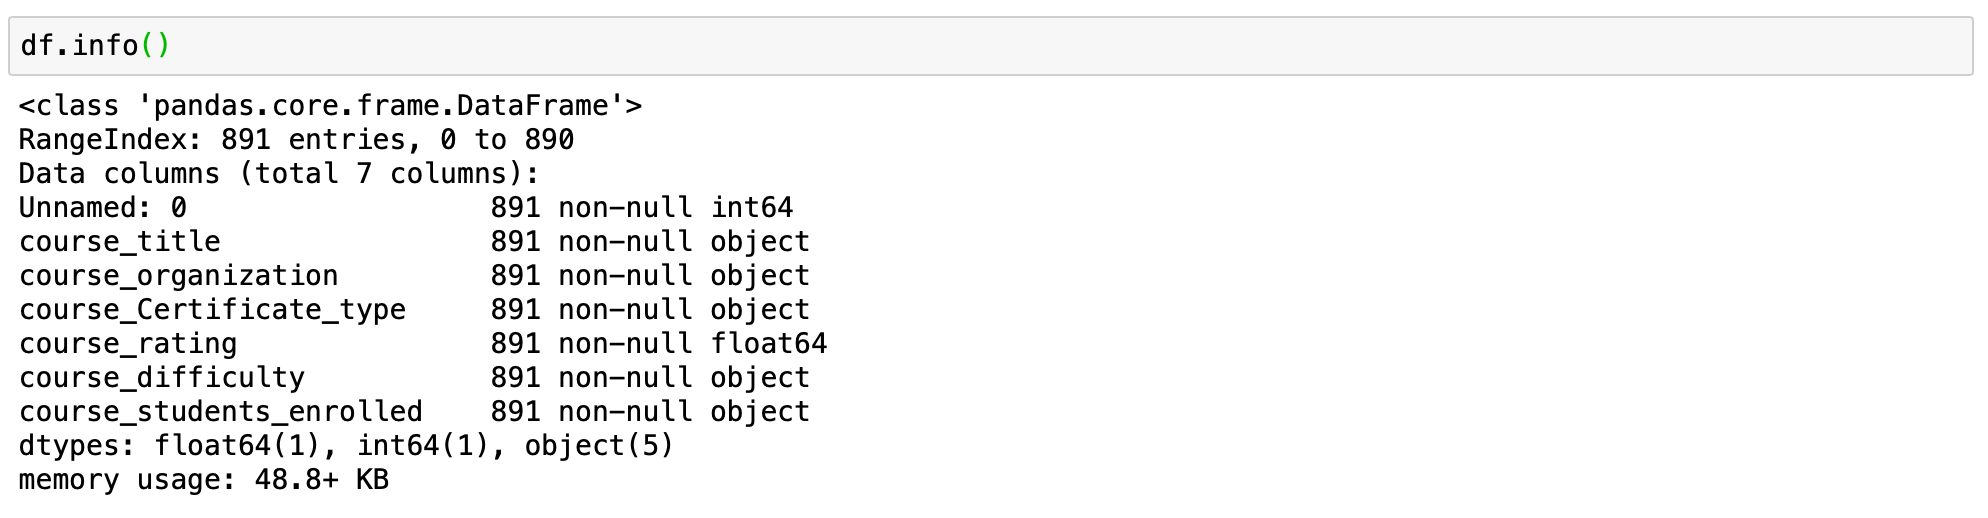
This tells us that we have 891 records in our dataset and that we don't have any NA values.
1. ) value_counts() with default parameters
Now we are ready to use value_counts function. Let begin with the basic application of the function.
Syntax - df['your_column'].value_counts()
We will get counts for the column course_difficulty from our dataframe.
# count of all unique values for the column course_difficulty
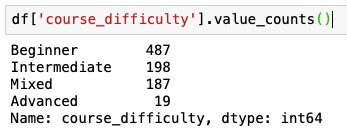
df['course_difficulty'].value_counts()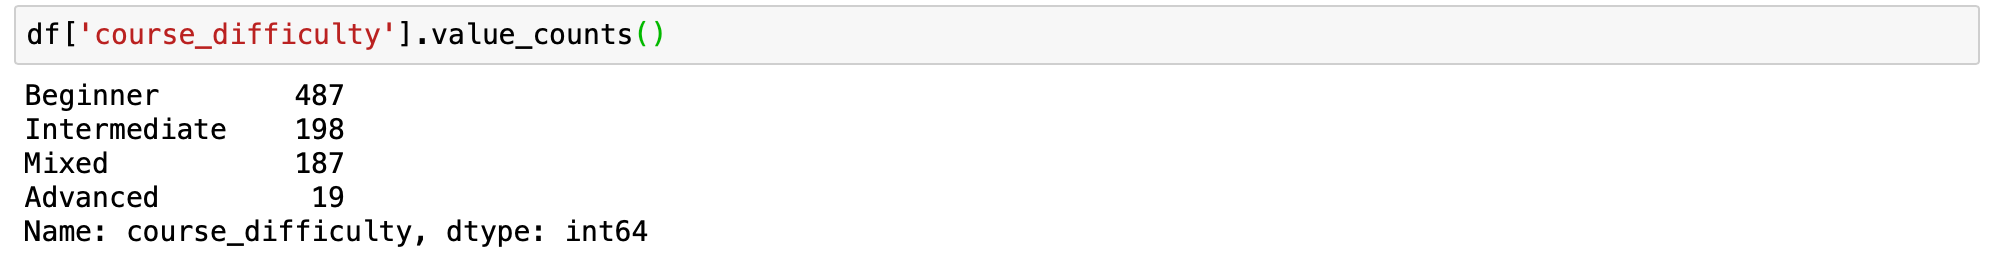
The value_counts function returns the count of all unique values in the given index in descending order without any null values. We can quickly see that the maximum courses have Beginner difficulty, followed by Intermediate and Mixed, and then Advanced.
Now that we understand the basic use of the function, it is time to figure out what parameters do.
2.) value_counts() in ascending order
The series returned by value_counts() is in descending order by default. We can reverse the case by setting the ascending parameter to True.
Syntax - df['your_column'].value_counts(ascending=True)
# count of all unique values for the column course_difficulty
# in ascending order

df['course_difficulty'].value_counts(ascending=True)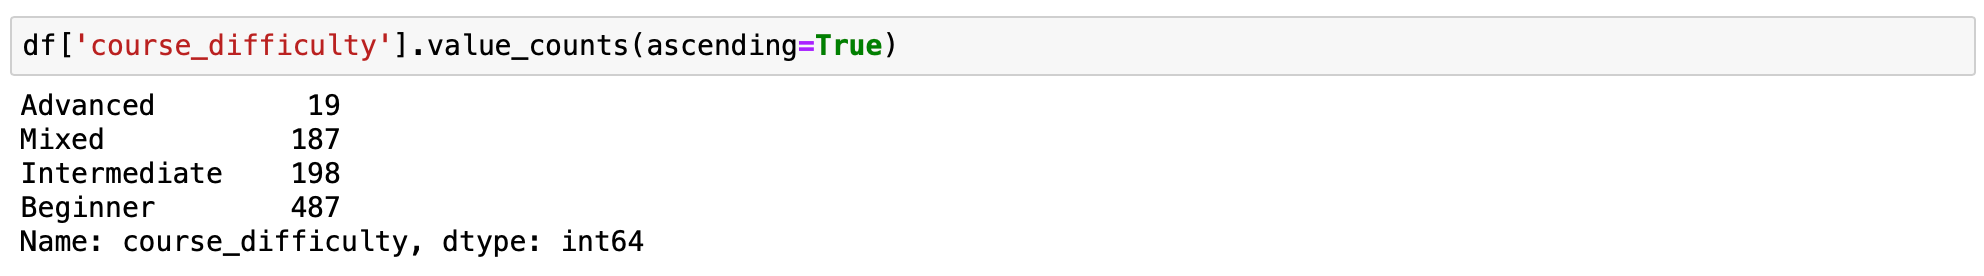
3.) value_counts() sorted alphabetically
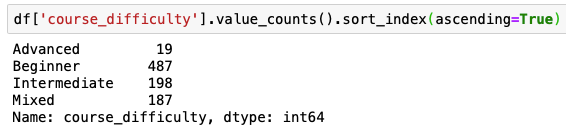
In some cases it is necessary to display your value_counts in an alphabetical order. This can be done easily by adding sort index sort_index(ascending=True) after your value_counts().
Default value_counts() for column "course_difficulty" sorts values by counts:
Value_counts() with sort_index(ascending=True) sorts by index (column that you are running value_counts() on:
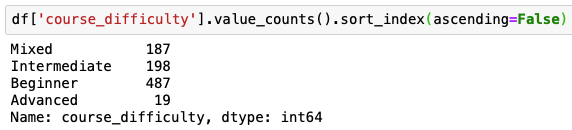
If you want to list value_counts() in reverse alphabetical order you will need to change ascending to False sort_index(ascending=False)
4.) Pandas value_counts(): sort by value, then alphabetically
Lets use for this example a slightly diffrent dataframe.
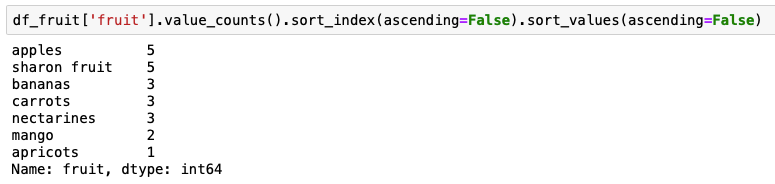
df_fruit = pd.DataFrame({
    'fruit':
       ['sharon fruit']*5 + ['apples']*5 + ['bananas']*3 +
       ['nectarines']*3 + ['carrots']*3 + ['apricots'] + ['mango']*2
})
Here we want to get output sorted first by the value counts, then alphabetically by the name of the fruit. This can be done by combining value_counts() with sort_index(ascending=False) and sort_values(ascending=False).
5.) value_counts() persentage counts or relative frequencies of the unique values
Sometimes, getting a percentage count is better than the normal count. By setting normalize=True, the object returned will contain the relative frequencies of the unique values. The normalize parameter is set to False by default.
Syntax - df['your_column'].value_counts(normalize=True)
# value_counts percentage view

df['course_difficulty'].value_counts(normalize=True)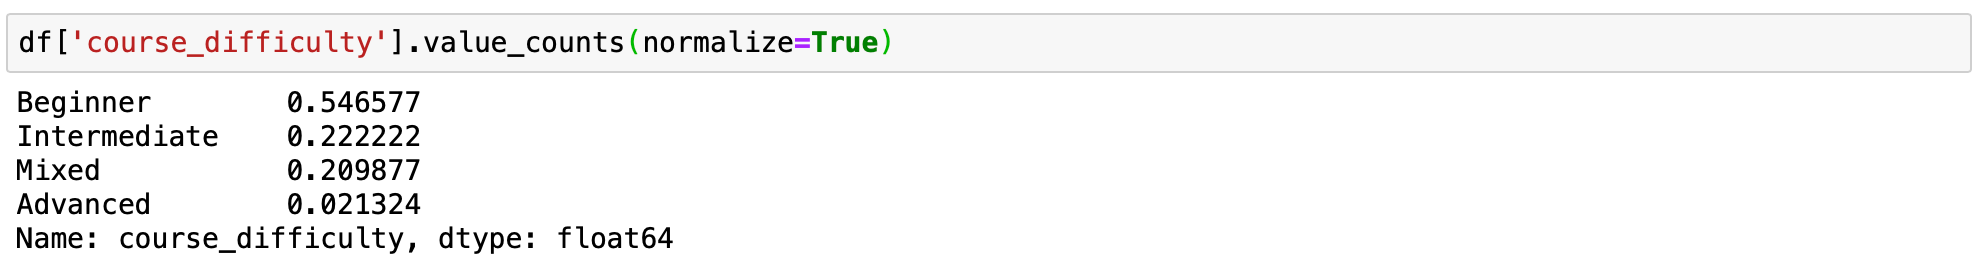
6.) value_counts() to bin continuous data into discrete intervals
This is one great hack that is commonly under-utilised. The value_counts() can be used to bin continuous data into discrete intervals with the help of the bin parameter. This option works only with numerical data. It is similar to the pd.cut function. Let’s see how it works using the course_rating column. Let’s group the counts for the column into 4 bins.
Syntax - df['your_column'].value_counts(bin = number of bins)
# applying value_counts with default parameters
df['course_rating'].value_counts()

# applying value_counts on a numerical column
# with the bin parameter

df['course_rating'].value_counts(bins=4)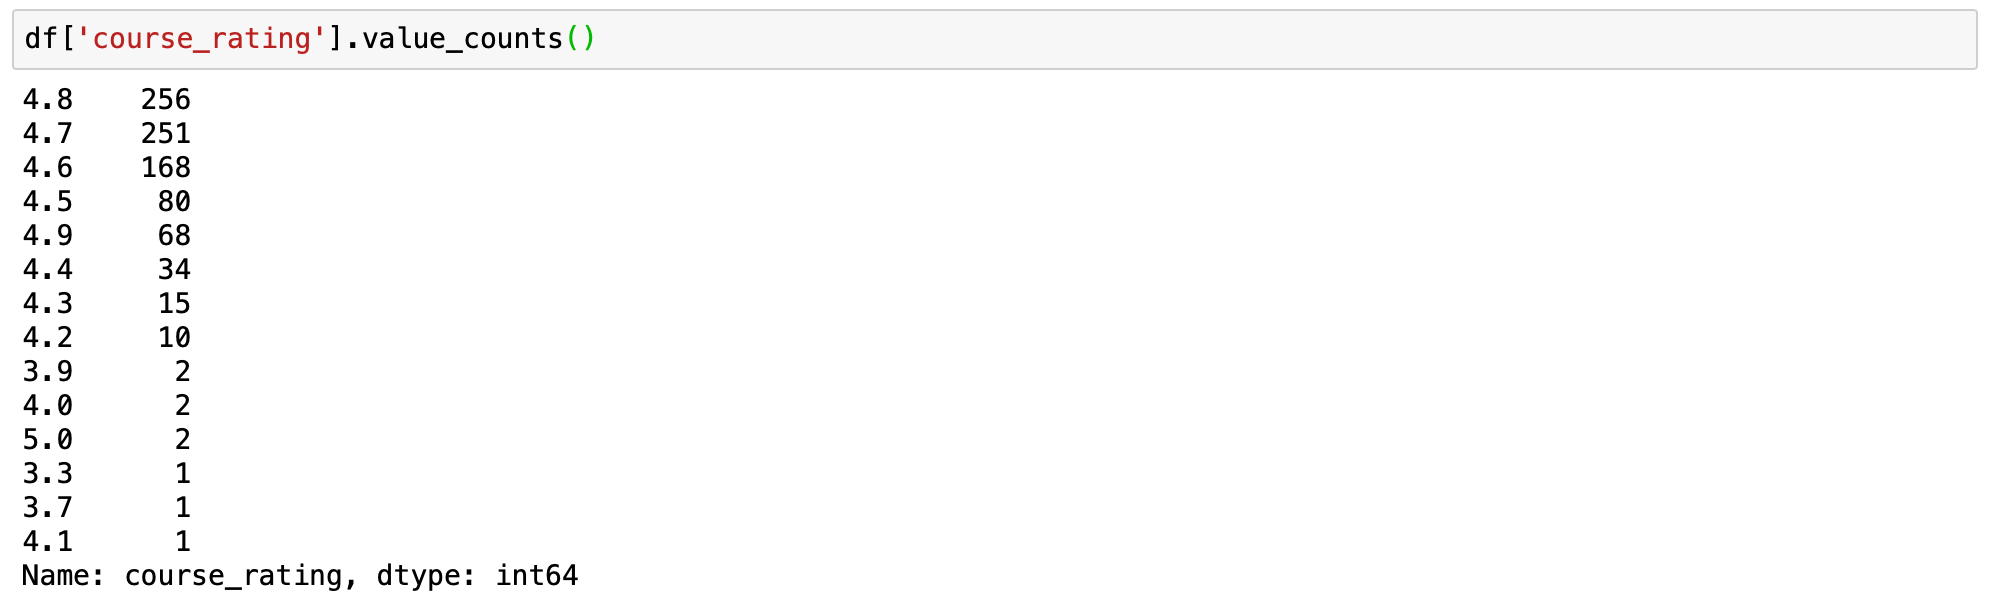
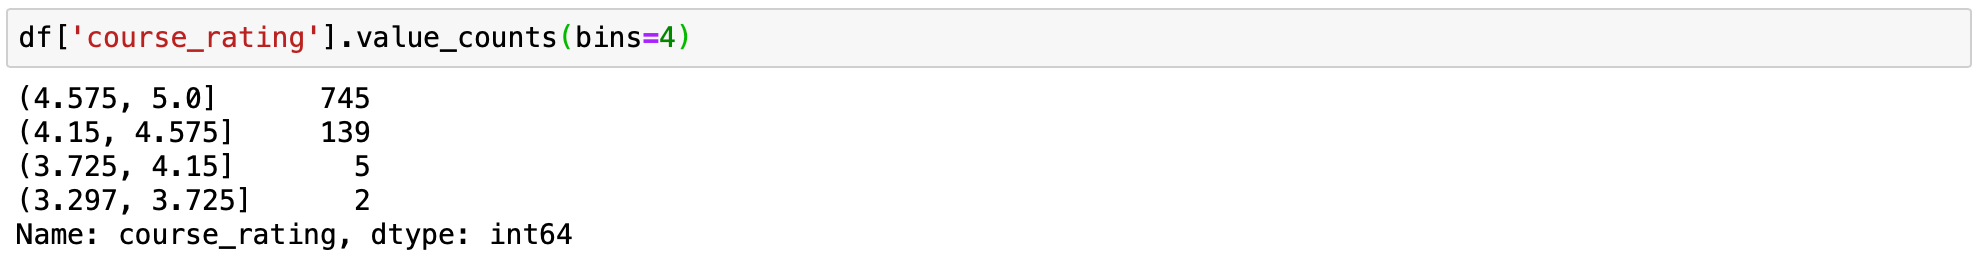
Binning makes it easy to understand the idea being conveyed. We can easily see that most of the people out of the total population rated courses above 4.5. With just a few outliers where the rating is below 4.15 (only 7 rated courses lower than 4.15).
7.) value_counts() displaying the NaN values
By default, the count of null values is excluded from the result. But, the same can be displayed easily by setting the dropna parameter to False. Since our dataset does not have any null values setting dropna parameter would not make a difference. But this can be of use on another dataset that has null values, so keep this in mind.
Syntax - df['your_column'].value_counts(dropna=False)
8.) value_counts() as dataframe
As mentioned at the beginning of the article, value_counts returns series, not a dataframe. If you want to have your counts as a dataframe you can do it using function .to_frame() after the .value_counts().
We can convert the series to a dataframe as follows:
Syntax - df['your_column'].value_counts().to_frame()
# applying value_counts with default parameters
df['course_difficulty'].value_counts()

# value_counts as dataframe
df['course_difficulty'].value_counts().to_frame()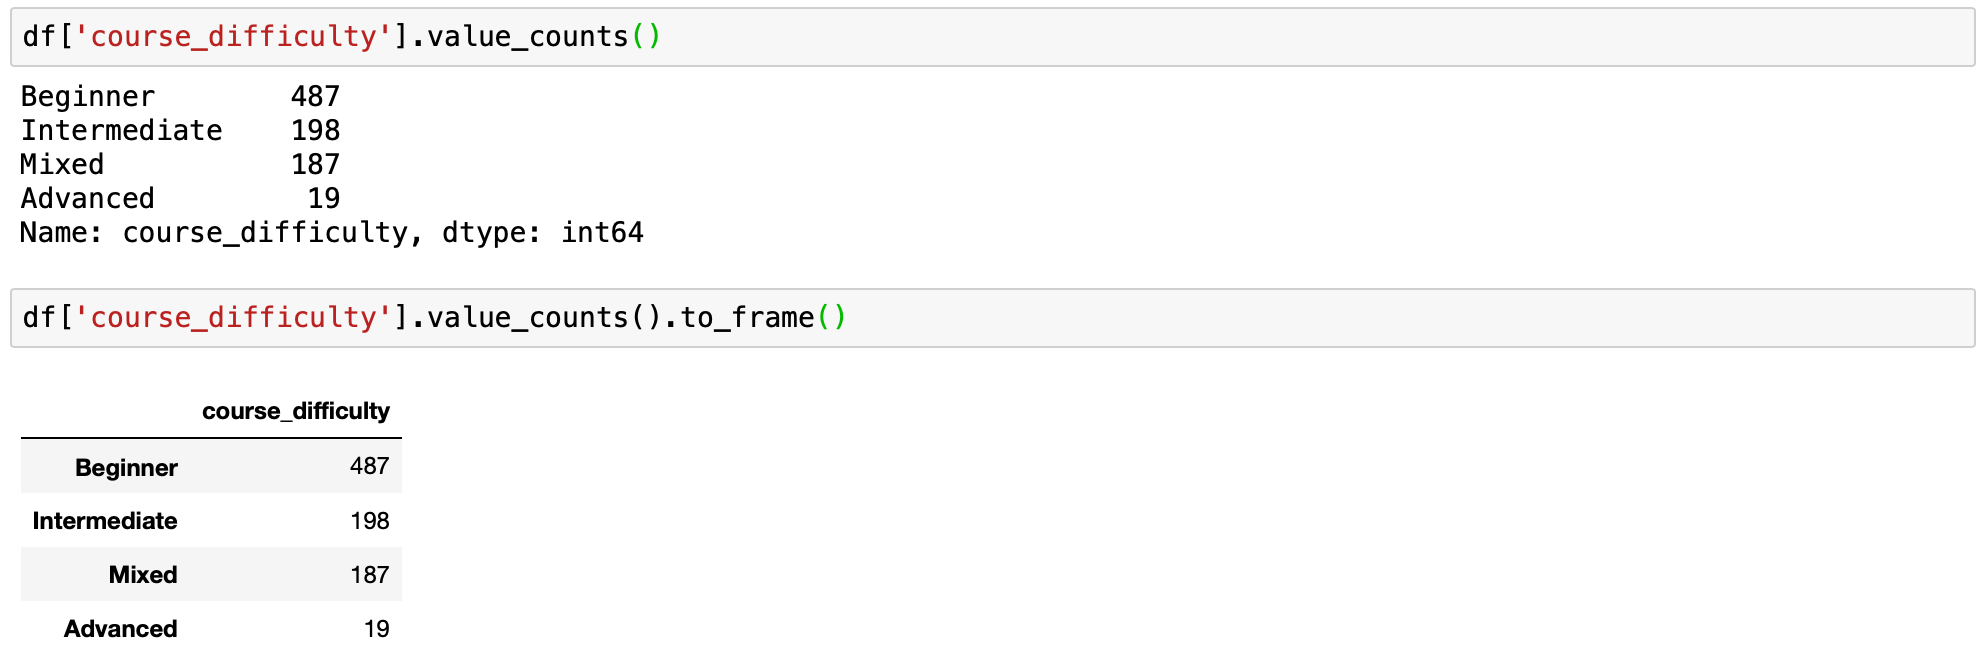
If you need to name index column and rename a column, with counts in the dataframe you can convert to dataframe in a slightly different way.
value_counts = df['course_difficulty'].value_counts()

# converting to df and assigning new names to the columns
df_value_counts = pd.DataFrame(value_counts)
df_value_counts = df_value_counts.reset_index()
df_value_counts.columns = ['unique_values', 'counts for course_difficulty'] # change column names
df_value_counts
9.) Group by and value_counts
This is one of my favourite uses of the value_counts() function and an underutilized one too. Groupby is a very powerful pandas method. You can group by one column and count the values of another column per this column value using value_counts.
Syntax - df.groupby('your_column_1')['your_column_2'].value_counts()
Using groupby and value_counts we can count the number of certificate types for each type of course difficulty.
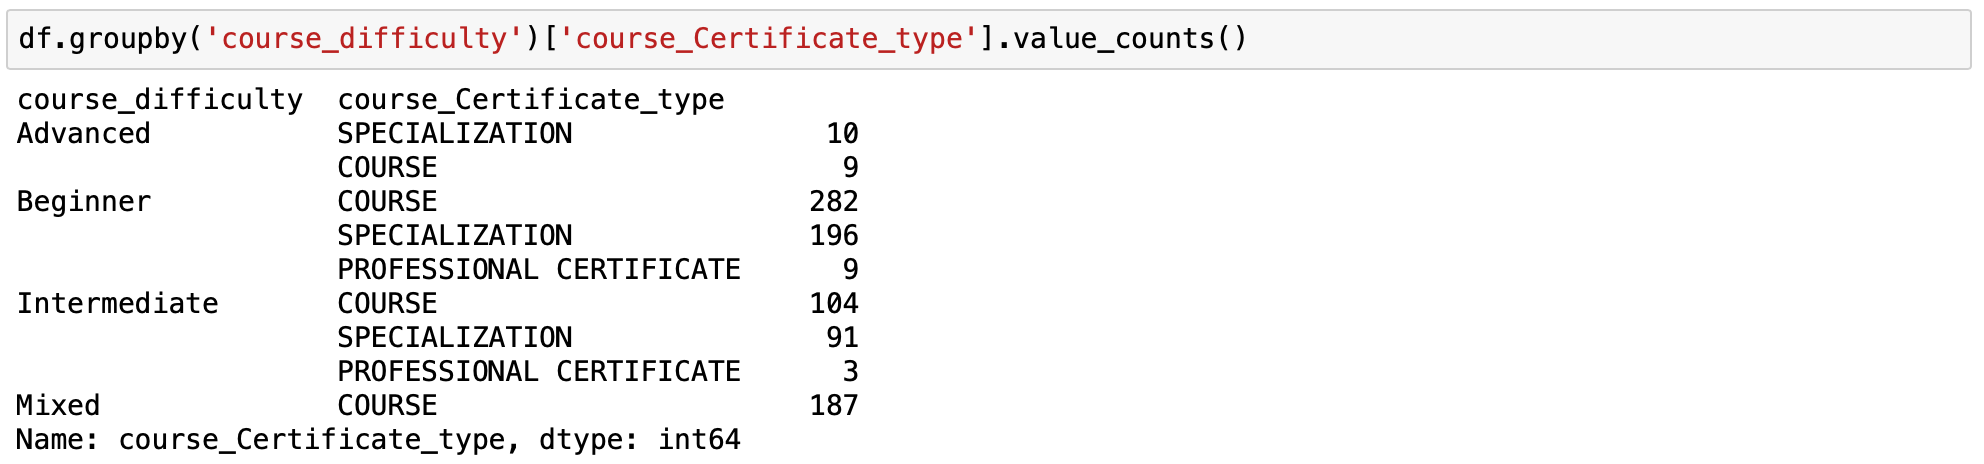
This is a multi-index, a valuable trick in pandas dataframe which allows us to have a few levels of index hierarchy in our dataframe. In this case, the course difficulty is the level 0 of the index and the certificate type is on level 1.
10. Pandas Value Counts With a Constraint
When working with a dataset, you may need to return the number of occurrences by your index column using value_counts() that are also limited by a constraint.
Syntax - df['your_column'].value_counts().loc[lambda x : x>1]
The above quick one-liner will filter out counts for unique data and see only data where the value in the specified column is greater than 1.
Let's demonstrate this by limiting course rating to be greater than 4.
# prints standart value_counts for the column
df['course_rating'].value_counts()

# prints filtered value_counts for the column
df['course_rating'].value_counts().loc[lambda x : x>4] 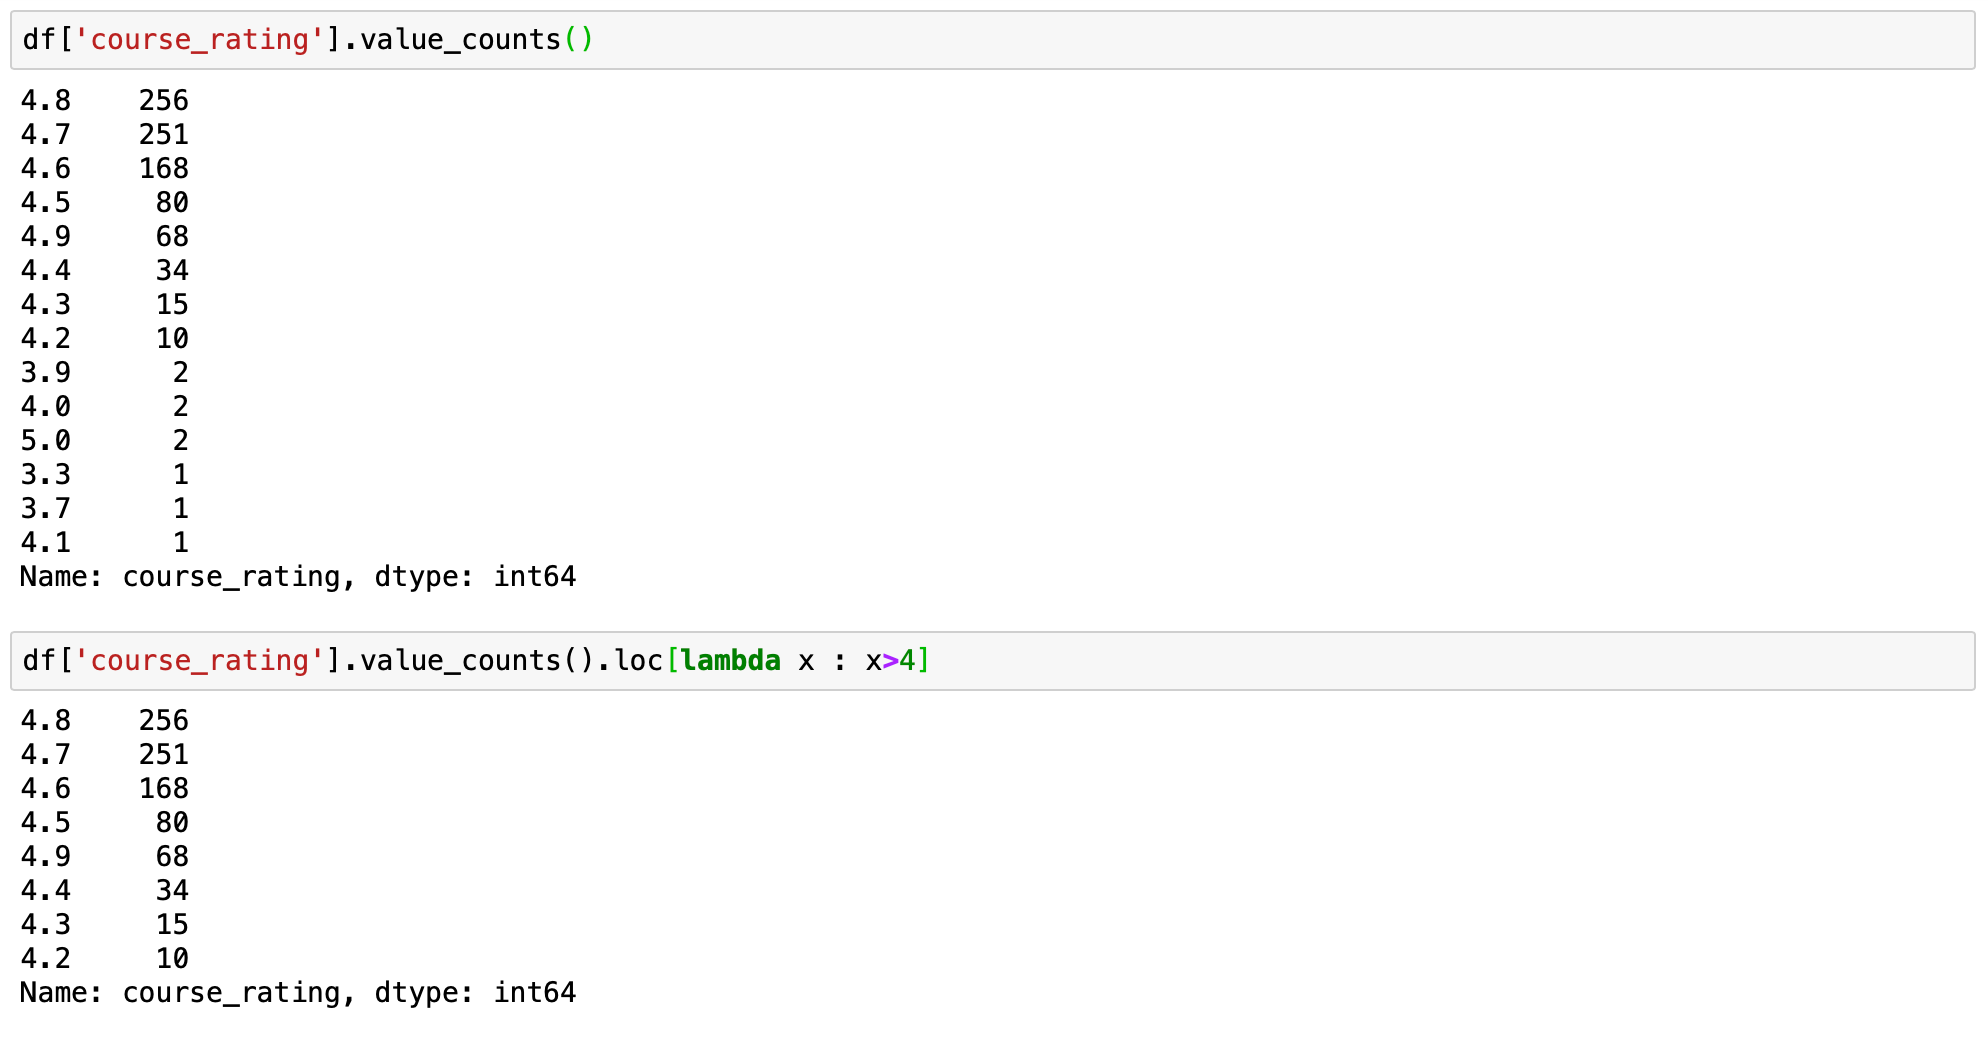
Hence, we can see that value counts is a handy tool, and we can do some interesting analysis with this single line of code.